Global smartphone sales growth slows down in Q3: Samsung's first quarter on top, Apple's rare sequential iPhone loss


Gartner Says Sales of Mobile Devices Grew 5.6 Percent in Third Quarter of 2011; Smartphone Sales Increased 42 Percent
- Android OS Rose to Account for More Than 50 Percent of Smartphone Sales
Egham, UK, November 15, 2011— Worldwide sales of mobile devices totaled 440.5 million units in the third quarter of 2011, up 5.6 percent from the same period last year, according to Gartner, Inc. Non-smartphone devices performed well, driven by demand in emerging markets for low-cost devices from white-box manufacturers, and for dual-subscriber identity module (SIM) devices.
Sales into the channel reached 460 million units. Gartner analysts said this increase was because of inventory build-up in the channel partly because of the shipping of new devices late in the quarter but mostly to prepare the channel for the holiday season. Gartner expects most of the build-up to be sold by the first quarter of 2012.
"Our forecast for the end of the year remains broadly in line at a worldwide level as regions such as Asia/Pacific and the Middle East and Africa make up for weaker performance in the Western European market," said Annette Zimmermann, principal analyst at Gartner based in Munich.
Smartphone sales to end users reached 115 million units in the third quarter of 2011, up 42 percent from the third quarter of 2010. Sequentially, smartphone sales slowed to 7 percent growth from the second quarter of 2011 to the third quarter of 2011. Smartphone sales accounted for 26 percent of all mobile phone sales, growing only marginally from 25 percent in the previous quarter.
"Strong smartphone growth in China and Russia helped increase overall volumes in the quarter, but demand for smartphones stalled in advanced markets such as Western Europe and the U.S. as many users waited for new flagship devices featuring new versions of the key operating systems," said Roberta Cozza, principal research analyst at Gartner. "Slowdowns also occurred in Latin America and the Middle East and Africa."
"Some consumers held off upgrading in the third quarter because they were waiting for promotions on other new high-end models that were launched in the run-up to the fourth quarter holiday season," Ms. Cozza said. "Other consumers were waiting for a rumored new iPhone and associated price cuts on older iPhone models; this affected U.S. sales particularly."
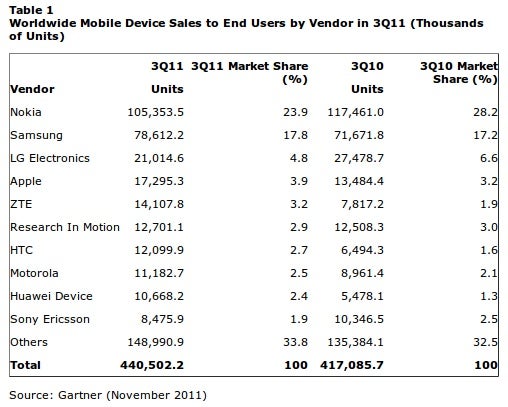
Despite a drop in market share, Nokia continued to be the worldwide leader in mobile device sales as it accounted for 23.9 percent of global sales (see Table 1). The second quarter of 2011 was the low point for Nokia, and the third quarter brought signs of improvement. Dual-SIM phones in particular, and feature phones generally, maintained Nokia's momentum in emerging markets. Heavy marketing from both Nokia and Microsoft to push the new Lumia devices should bring more improvement in the fourth quarter of 2011. However, a true turnaround won't take place until the second half of 2012.
Table 1
Worldwide Mobile Device Sales to End Users by Vendor in 3Q11 (Thousands of Units)
Vendor | 3Q11 Units | 3Q11 Market Share (%) | 3Q10 Units | 3Q10 Market Share (%) |
Nokia | 105,353.5 | 23.9 | 117,461.0 | 28.2 |
Samsung | 78,612.2 | 17.8 | 71,671.8 | 17.2 |
LG Electronics | 21,014.6 | 4.8 | 27,478.7 | 6.6 |
Apple | 17,295.3 | 3.9 | 13,484.4 | 3.2 |
ZTE | 14,107.8 | 3.2 | 7,817.2 | 1.9 |
Research In Motion | 12,701.1 | 2.9 | 12,508.3 | 3.0 |
HTC | 12,099.9 | 2.7 | 6,494.3 | 1.6 |
Motorola | 11,182.7 | 2.5 | 8,961.4 | 2.1 |
Huawei Device | 10,668.2 | 2.4 | 5,478.1 | 1.3 |
Sony Ericsson | 8,475.9 | 1.9 | 10,346.5 | 2.5 |
Others | 148,990.9 | 33.8 | 135,384.1 | 32.5 |
Total | 440,502.2 | 100 | 417,085.7 | 100 |
Source: Gartner (November 2011)
Samsung became the No. 1 smartphone manufacturer worldwide as sales to end users tripled year over year to reach 24 million; sell in was high as the channel built inventory. Samsung was the No. 1 smartphone manufacturer for the first time, ahead of Nokia in Western Europe and Asia. Gartner attributes this to the strong performance of Samsung's Galaxy smartphones, which now cover a broad range of prices, and a weaker competitive market. Analysts expect more competition in the fourth quarter of 2011, not least because sales of the iPhone 4S, 4 and 3GS will capture share from Android manufacturers.
Apple shipped 17 million iPhones, an annual increase of 21 percent, but down nearly 3 million units from the second quarter of 2011 because of Apple's new device announcement in October. Gartner believes Apple will bounce back in the fourth quarter because of its strongest ever preorders for the iPhone 4S in the first weekend after its announcement. Markets such as Brazil, Mexico, Russia and China are becoming more important to Apple, representing 16 percent of overall sales and showing that the iPhone has a place in emerging markets, especially now that the 3GS and 4 have received price cuts.
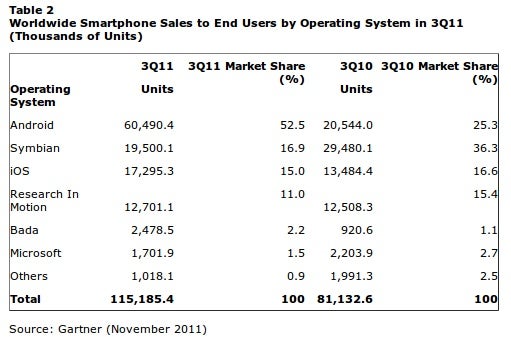
The Android OS accounted for 52.5 percent of smartphone sales to end users in the third quarter of 2011 (see Table 2), more than doubling its market share from the third quarter of 2010.
"Android benefited from more mass-market offerings, a weaker competitive environment and the lack of exciting new products on alternative operating systems such as Windows Phone 7 and RIM," Ms. Cozza said. "Apple's iOS market share suffered from delayed purchases as consumers waited for the new iPhone. Continued pressure is impacting RIM's performance, and its smartphone share reached its lowest point so far in the U.S. market, where it dropped to 10 percent."
Table 2
Worldwide Smartphone Sales to End Users by Operating System in 3Q11 (Thousands of Units)
Operating System | 3Q11 Units | 3Q11 Market Share (%) | 3Q10 Units | 3Q10 Market Share (%) |
Android | 60,490.4 | 52.5 | 20,544.0 | 25.3 |
Symbian | 19,500.1 | 16.9 | 29,480.1 | 36.3 |
iOS | 17,295.3 | 15.0 | 13,484.4 | 16.6 |
Research In Motion | 12,701.1 | 11.0 | 12,508.3 | 15.4 |
Bada | 2,478.5 | 2.2 | 920.6 | 1.1 |
Microsoft | 1,701.9 | 1.5 | 2,203.9 | 2.7 |
Others | 1,018.1 | 0.9 | 1,991.3 | 2.5 |
Total | 115,185.4 | 100 | 81,132.6 | 100 |
Source: Gartner (November 2011)


Things that are NOT allowed: