The rise of "super apps" shown in an infographic
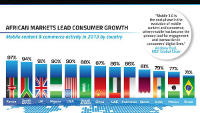
According to MEF, a global trade association for mobile commerce, the market for mobile content has gone through several phases. During the first phase, called Mobile 1.0, consumers used to buy simple customization products (such as ringtones and wallpapers) for their phones. Throughout the second phase, Mobile 2.0, users started purchasing apps and games. According to the association, we have recently transitioned to a new phase, called Mobile 3.0, which is characterized by the so called "super apps". These are gradually displacing conventional pay-once apps by offering long-term subscriptions for given services, such as Spotify or Netflix.
A recent infographic summarizes the data, collected from MEF's annual consumer survey, and depicts the "rise of Mobile 3.0". The survey accounts for more than 10,000 consumers from 13 different countries.
Interestingly, most of the "high-spenders", the respondents that payed most for mobile content, are situated in Kenya, Nigeria and Mexico. More than 50% of Kenyan consumers say they have spent more than $150 on mobile goods and subscription services. Their main motivation for purchasing such content was mostly for entertainment purposes. On the other hand, consumers in the USA are mostly motivated by convenience. Only 20% of them have spent more than $150 on mobile goods and services, which is one of the lowest results among the surveyed countries.
"Mobile 3.0 is the next phase in the evolution of mobile content and commerce, where mobile has become the primary tool for engagement and transaction in consumers' digital lives." - says Andrew Bud, MEF Global Chair.
A recent infographic summarizes the data, collected from MEF's annual consumer survey, and depicts the "rise of Mobile 3.0". The survey accounts for more than 10,000 consumers from 13 different countries.
According to the information, the overall volume of purchased mobile content in 2013 has declined in comparison with 2012, but the value of purchased goods has increased. In the USA, for example, 66% of the interviewed consumers said that they have purchased some kind of mobile content in 2013, while in 2012 this percentage was 74%.
Interestingly, most of the "high-spenders", the respondents that payed most for mobile content, are situated in Kenya, Nigeria and Mexico. More than 50% of Kenyan consumers say they have spent more than $150 on mobile goods and subscription services. Their main motivation for purchasing such content was mostly for entertainment purposes. On the other hand, consumers in the USA are mostly motivated by convenience. Only 20% of them have spent more than $150 on mobile goods and services, which is one of the lowest results among the surveyed countries.








Things that are NOT allowed: