A newly-published comScore report, focused on the mobile app market, reveals some quite surprising facts about the US smartphone users that may not necessarily sound right to you.
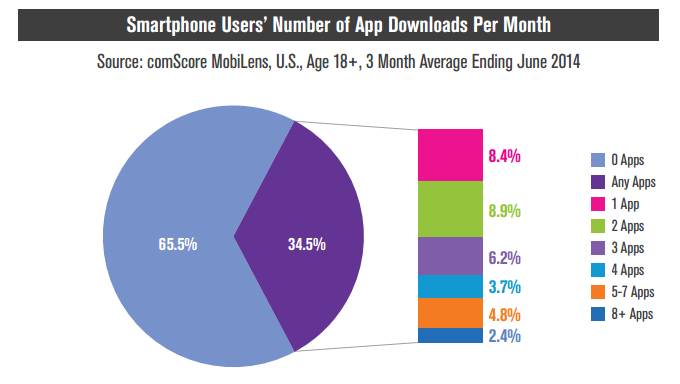
As gleaned from the title, the most notable of the findings is the massive scale at which users simply refuse to bother with going to the app store, whether we're talking iOS or Android, and that's despite the overall increase in app downloads and time spent within them. According to comScore, a massive 65.5% of US smartphone users download exactly zero apps per month, with a combined 23.5% accounting for anywhere between one, two, or three downloads per month. The remaining user base (11%) is responsible for the lion's share of monthly app downloads.
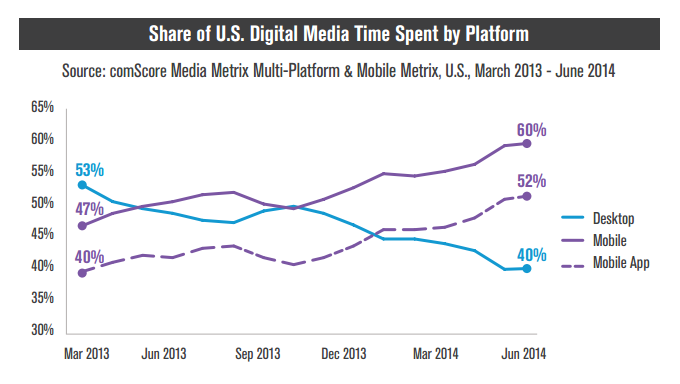
Speaking of apps, those now account for seven out of every eight minutes of media consumption on mobile devices. Smartphones are also increasingly replacing the desktop computer in that metric, with mobiles now accounting for a whopping 60% of all media consumption (40% for desktop). These figures showcase a changing landscape, as at this point last year, desktops still held the lead at 53%, while smartphones accounted for 47%.
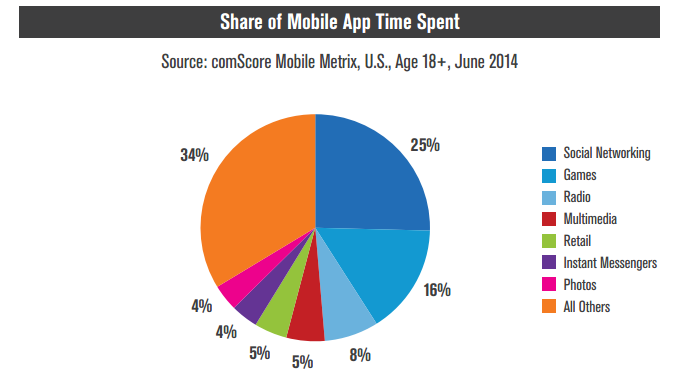
The most popular app category seems to be Social Networking, which accounts for a quarter of all app engagement. Next on the list are Games and Radio, with 16% and 8% respectively. Least engaging of all appear to be Instant Messengers and Photos, both with a 4% share.
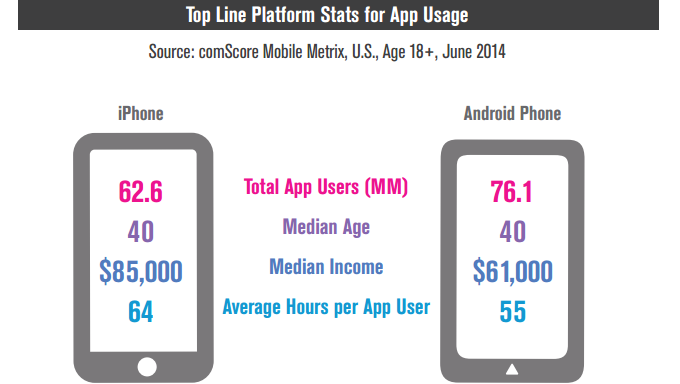
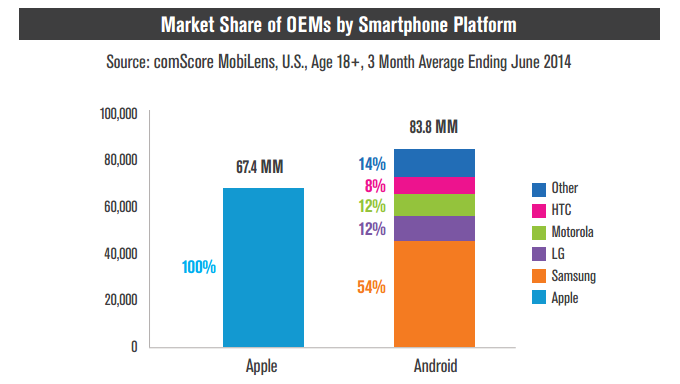
Taking a look at app usage across the two rival platforms, the numbers are equally interesting. For example, while on the whole there are far less iPhone than Android devices, the Apple camp has some 62.6 million app users, while Android only has 76.1 million. iOS users also spend 9 hours more inside apps per month on average compared with Android users. Lastly, while the median age of both platform's app users is 40, there's a massive disparity in their income groups. iOS users, on average, have a yearly income of $85K -- 40% more than Android's average of $61K.
Last but not least, comScore also estimated the share which each major Android OEM holds. With 54%, Samsung is by far the most popular Android brand in the States, followed by LG and Motorola (both with 12%), HTC (8%), and 14% for the rest of the brands.
Recommended Stories
For those of you looking for the full scoop, just follow the link to comScore's report down below. You'll need to provide basic contact information before you can download the report.
Chris Panayotov is a former mobile tech reviewer of phones, tablets and wearables at PhoneArena. However, his contribution to PhoneArena content includes not just reviews, but all kinds of regular and experimental features, such as news stories, buying guides, and an exclusive column on the most notable phones out of Asia.
Recommended Stories
Loading Comments...
COMMENT
All comments need to comply with our
Community Guidelines
Phonearena comments rules
A discussion is a place, where people can voice their opinion, no matter if it
is positive, neutral or negative. However, when posting, one must stay true to the topic, and not just share some
random thoughts, which are not directly related to the matter.
Things that are NOT allowed:
Off-topic talk - you must stick to the subject of discussion
Offensive, hate speech - if you want to say something, say it politely
Spam/Advertisements - these posts are deleted
Multiple accounts - one person can have only one account
Impersonations and offensive nicknames - these accounts get banned
Moderation is done by humans. We try to be as objective as possible and moderate with zero bias. If you think a
post should be moderated - please, report it.
Have a question about the rules or why you have been moderated/limited/banned? Please,
contact us.


Things that are NOT allowed: